Python Function Parameter
December 21, 2024 · 4 min read
This blog will review the function parameter of Python. Mainly about the parameter passing, Keyword and Position Parameter, Anonymous Function, and unit test with assert.
This blog will review the function parameter of Python. Mainly about the parameter passing, Keyword and Position Parameter, Anonymous Function, and unit test with assert.
This blog will review the control structure of Python.
...This article will review the composite data type in Python, such as list, tuple, dictionary, and set.
This article will explore data types and common methods for them in Python.
The content of this review is as follows: number type, string type, boolean type and type conversion.

Sometimes you may forget about the basic of Python, so let us take a look at the summary of Python basic summary. The content of this review is as follows: data type, variable, control flow, input & output, PEP8 format.
Scalar variables are denoted by ordinary lowercase letters (for example, $x$, $y$, and $z$). $\mathbb{R}$ denotes the space of all (continuous) real-valued scalars, and $x\in\mathbb{R}$ is the formal way to say that $x$ is a real-valued scalar. A scalar is represented by a tensor with only one element.
...The data is stored in the CSV (comma-separated values) file ../data/house_tiny.csv.
import os

os.makedirs(os.path.join('..', 'data'), exist_ok=True)
data_file = os.path.join('..', 'data', 'house_tiny.csv')
with open(data_file, 'w') as f:
    f.write('NumRooms,Alley,Price\n')  # Column names
    f.write('NA,Pave,127500\n')  # Each row represents one data sample
    f.write('2,NA,106000\n')
    f.write('4,NA,178100\n')
    f.write('NA,NA,140000\n')

# To load the raw dataset from the CSV file we created, import `pandas` and call `read_csv`.
# !pip install pandas
import pandas as pd

data = pd.read_csv(data_file)
print(data)

#    NumRooms Alley   Price
# 0       NaN  Pave  127500
# 1       2.0   NaN  106000
# 2       4.0   NaN  178100
# 3       NaN   NaN  140000
An $n$-dimensional array is also called a tensor. Regardless of the deep learning framework, its tensor class (ndarray in MXNet and Tensor in PyTorch and TensorFlow) is similar to NumPy’s ndarray.
During deep learning training, we usually do not read images one at a time. Instead, we might read 128 images at once. This is a batch, represented by a four-dimensional array.
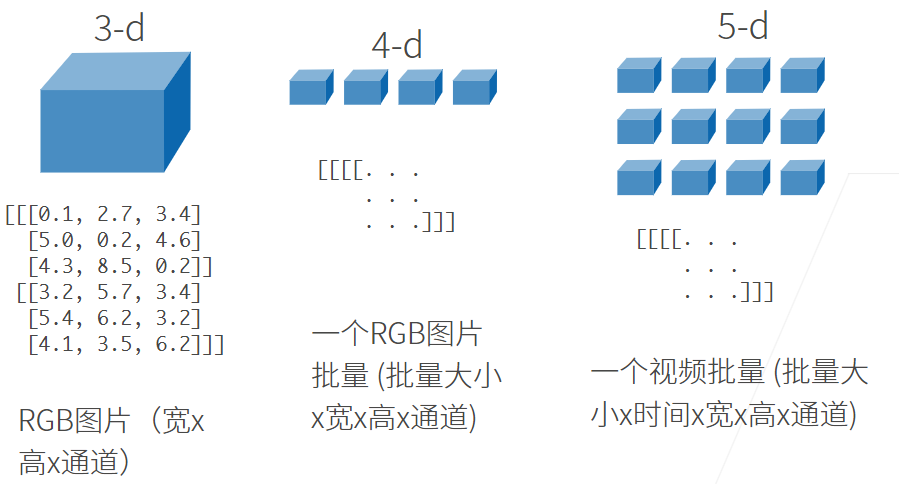 Deep learning frameworks also offer important features beyond NumPy’s
ndarray:
...A tensor with one axis corresponds to a mathematical vector; A tensor with two axes corresponds to a mathematical matrix.
Seaborn’s kdeplot() function is one way to draw density plots in Python. At present, Matplotlib does not have a specific function for drawing density plots, and plotting is generally performed in combination with the result of the gaussian_kde() function in the Scipy library.
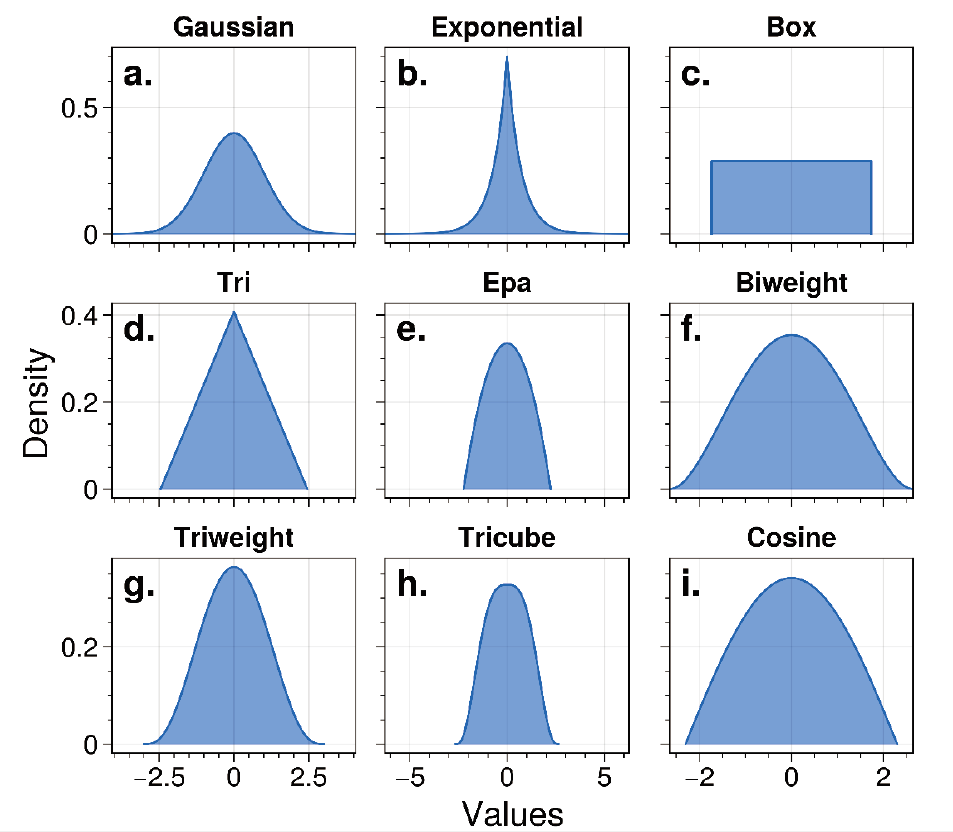
The neighbors.KernelDensity () module in Python’s scikit-learn library provides six kernel functions—Gaussian, Tophat, Epanechnikov, Exponential, Linear, and Cosine—for kernel density estimation calculations. Python’s KDEpy library provides as many as nine kernel functions, including Gaussian, Exponential, Box, Tri, Epa, Biweight, Triweight, Tricube,
Cosine.
A schematic diagram of the nine kernel functions in the KDEpy library is shown below:
A univariate plot (chart for one variable) refers to drawing a corresponding plot using one variable from a dataset. To visualize this variable, a plot must be drawn according to the different data variable types. Data variables are divided into continuous variables and discrete variables.
...