Plotting Tools and Their Key Features
August 22, 2023 · 2 min read
If you have any questions, feel free to comment below. Click the block can copy the code.
And if you think it's helpful to you, just click on the ads which can support this site. Thanks!
Python has multiple third-party libraries, including the basic plotting library Matplotlib, the statistical analysis visualization library Seaborn, the scientific plotting library ProPlot, and the scientific plotting theme library SciencePlots.
Matplotlib #
Graphical Elements #
The main graphical elements used to draw graphics with Matplotlib include the canvas (figure), coordinate plot (axes), axis (axis), and artistic object (aritist). Among them, coordinate graphics include most of the layer properties required for plotting, such as the figure name (title), tick (tick), tick label (tick label), axis label (axis label), spine (spine), legend (legend), grid (grid), line (line), and data marker (marker).
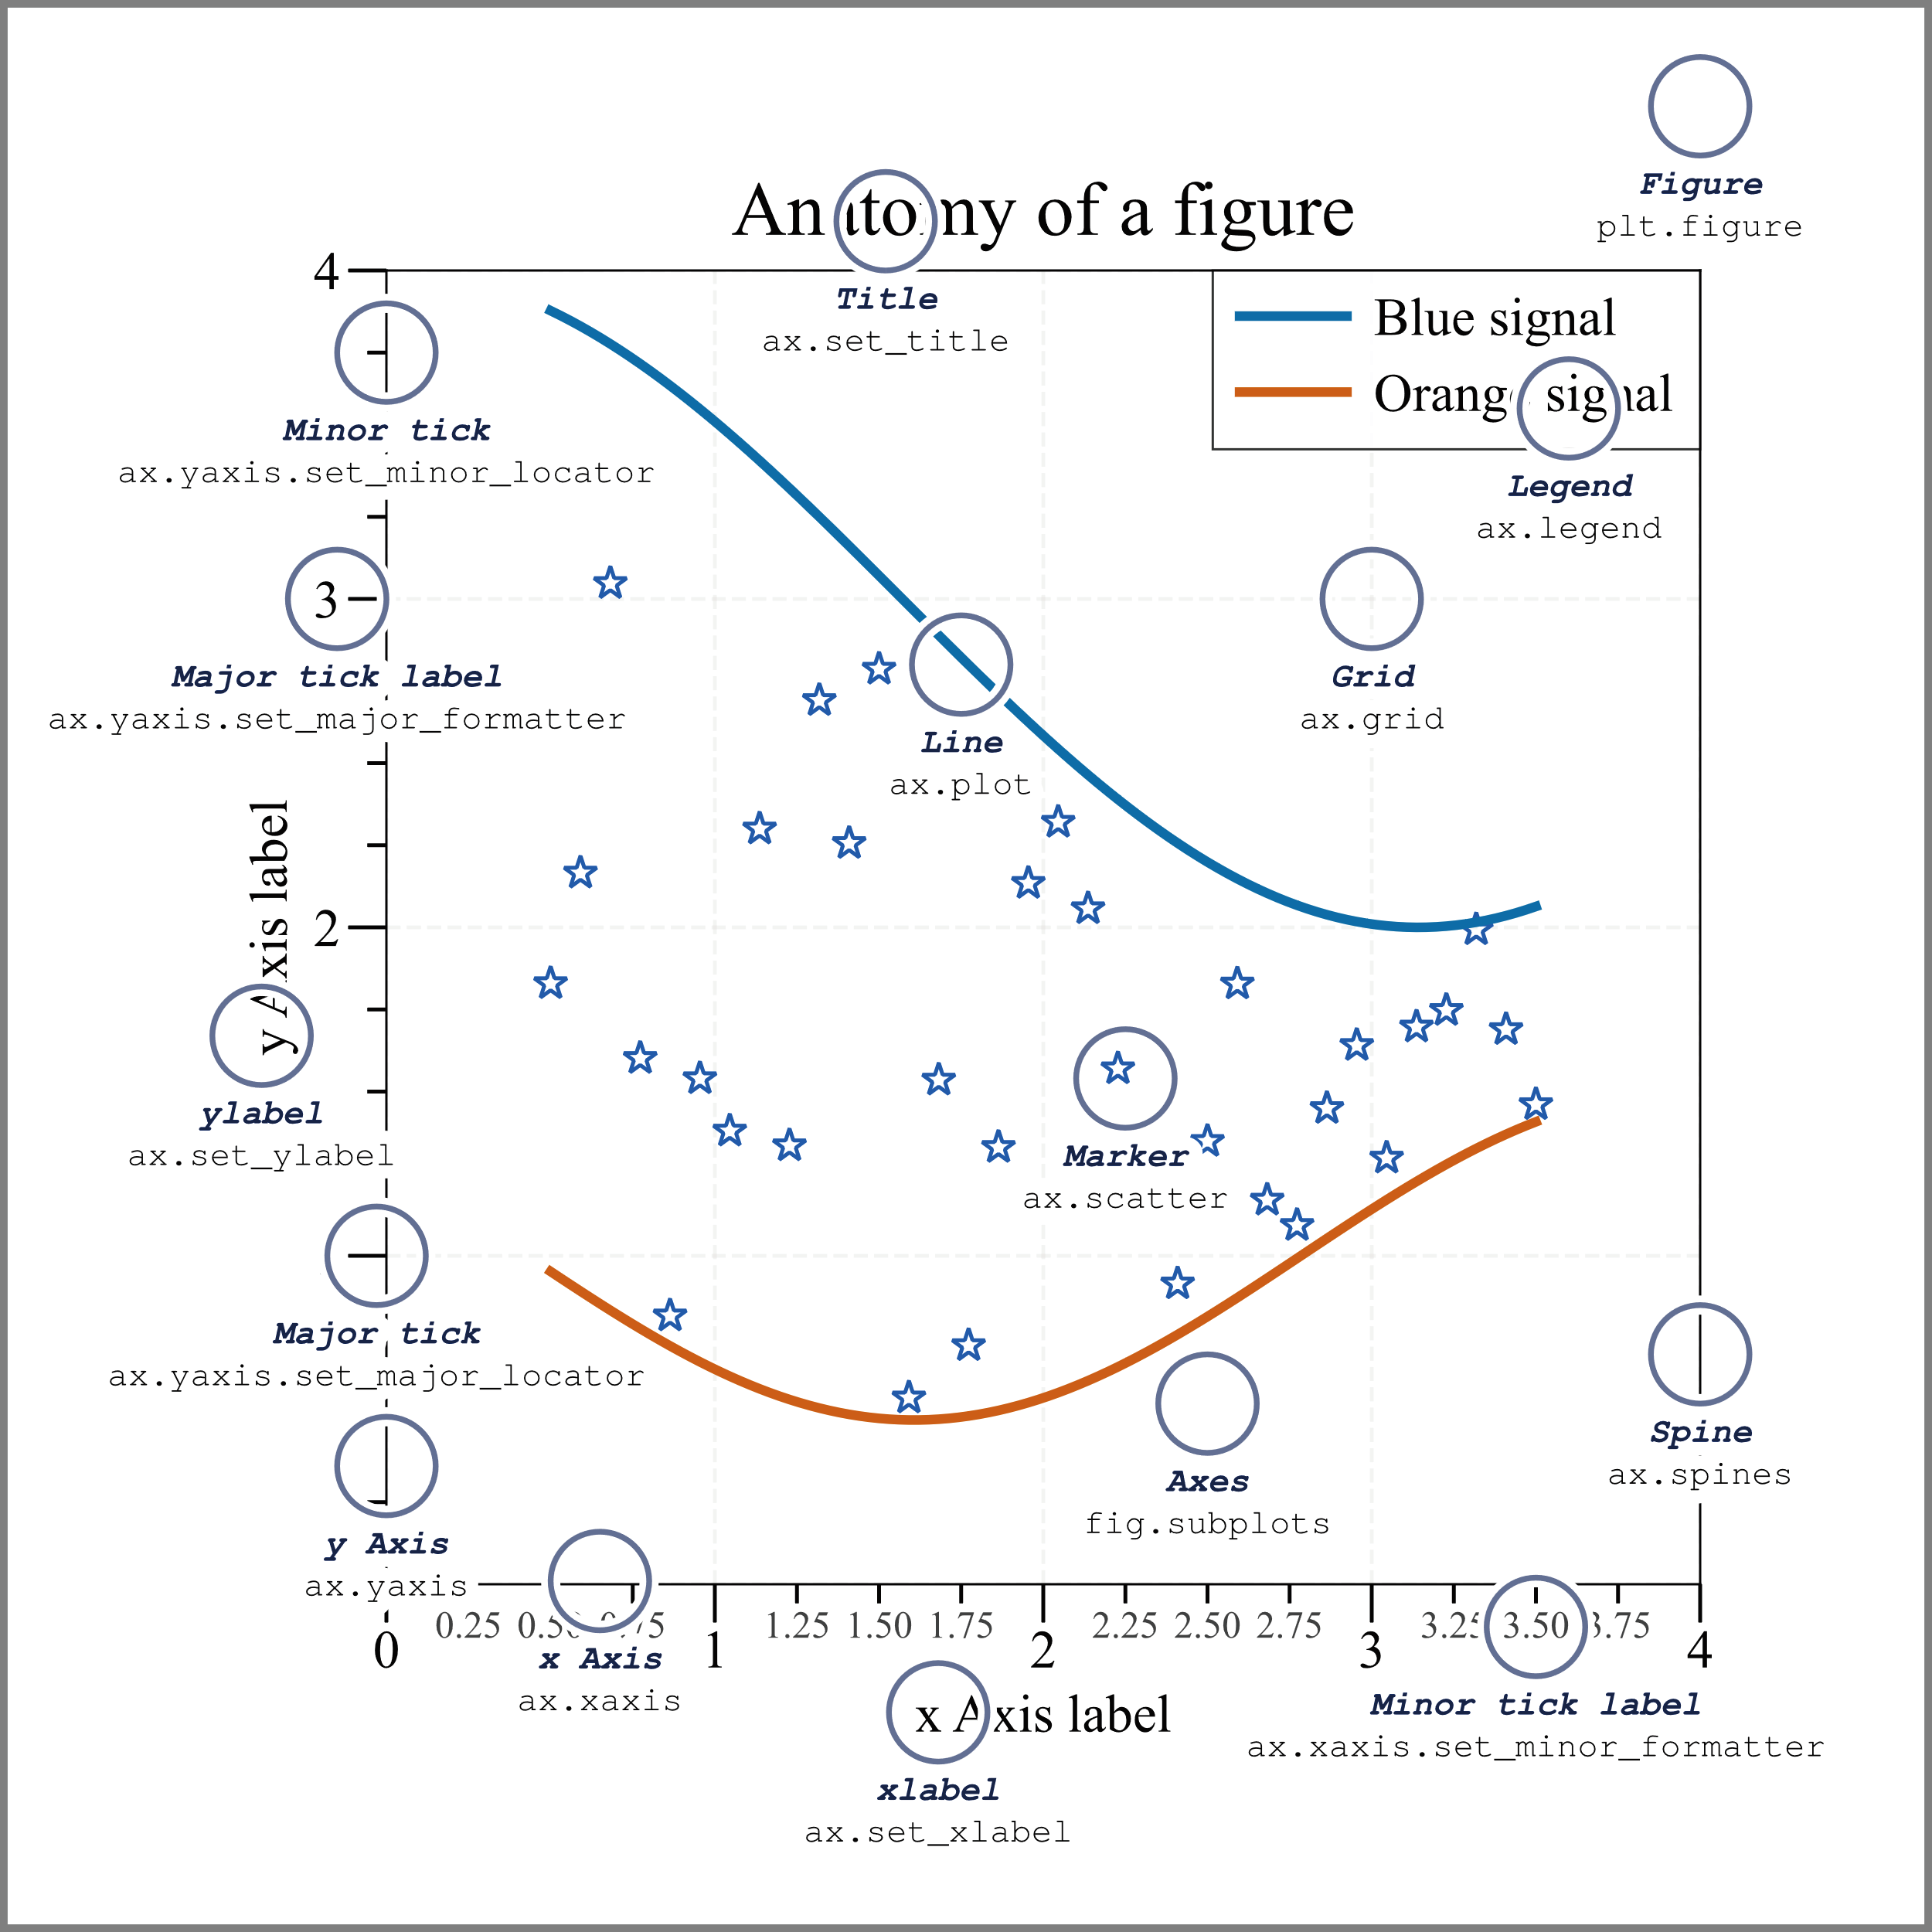
Matplotlib includes primitive class (primitive) elements and container class (container) elements.
- Primitive class elements include common points (point), lines (line), text (text), grids (grid), titles (title), legends (legend), etc.;
- Container class elements refer to a collection of one or more primitive class elements, mainly including figures, coordinate graphics, axes, and ticks.
- Canvas (figure). As a basic graphical element in Matplotlib, it also contains multiple other graphical elements. It can represent the figure itself for drawing a plot (containing multiple graphical artistic objects such as legends, figure names, and data markers, and can also be divided into multiple subregions, while each subregion can be used to draw a separate graphics type (subplot). Users can set the canvas size (figsize), resolution (dpi), background color, and other parameters in the canvas (figure).
- Coordinate graphic (axes), also called a subplot. As the plotting core of Matplotlib, it mainly provides a display area for plotting data and also includes the many artistic objects (artist) that make up the plot. In most cases, one canvas (figure) object contains one subplot region, and the subplot region consists of four spines at the top, bottom, left, and right, as well as other constituent elements that make up the subplot.
- Axis (axis): a data axis object, namely a coordinate axis line. Each axis object contains a locator object and a formatter object, which are used to control the position and format of coordinate-axis ticks, respectively.
- Tick (tick), namely a tick object. Each coordinate graphic has a horizontal X axis object and a vertical Y axis object. Each coordinate axis contains tick objects. Tick objects include major ticks (Major tick), minor ticks (Minor tick), major tick labels (Major tick label), and minor tick labels (Minor tick label).
Primitive class elements and container class elements are collectively called artistic objects (artist) in the Matplotlib library. Under normal circumstances, artistic objects are bound to coordinate graphic (axes) objects and cannot be shared by other or multiple coordinate graphic objects, nor can they be moved from one coordinate graphic region to another coordinate graphic region.
Related readings
- Overview of the AI Development Software Environment
- Image Classification and Foundational Vision Models
If you want to follow my updates, or have a coffee chat with me, feel free to connect with me: