January 3, 2024
·
3 min read
Syntax Basics
#
Variables
#
- In Java, outputting a variable without assigning it a value causes an error.
- Built-in data types
| Type | Bytes | Example | Additional notes |
|---|
| byte | 1 | 123 | |
| short | 2 | 12345 | $2^{16}=65536$ |
| int | 4 | 123456789 | $2^{32}=2147483648≈2.1*10^9$ |
| long | 8 | 1234567891011L | $2^{64}≈10^{18}$ |
| float | 4 | 1.2F | About 6 or 7 significant decimal digits; subsequent digits are imprecise approximations. To explicitly denote a float, append f or F. |
| double | 8 | 1.2, 1.2D | About 15 or 16 significant decimal digits; subsequent digits are imprecise approximations. To explicitly denote a double, append d or D. |
| boolean | 1 | true, false | |
| char | 2 | ‘A’ | ASCII code correspondences: a-97 A-65 0-48 |
Read the full text -> A total of 0.71k words
August 31, 2023
·
13 min read
Seaborn’s kdeplot() function is one way to draw density plots in Python. At present, Matplotlib does not have a specific function for drawing density plots, and plotting is generally performed in combination with the result of the gaussian_kde() function in the Scipy library.
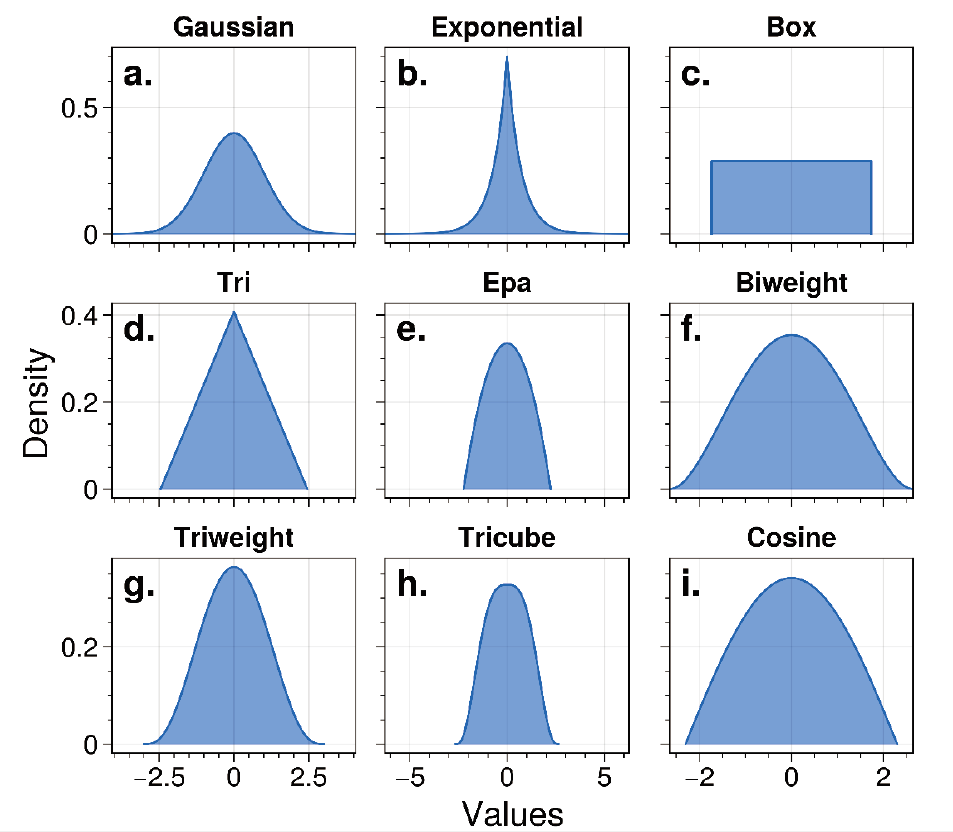
The neighbors.KernelDensity () module in Python’s scikit-learn library provides six kernel functions—Gaussian, Tophat, Epanechnikov, Exponential, Linear, and Cosine—for kernel density estimation calculations. Python’s KDEpy library provides as many as nine kernel functions, including Gaussian, Exponential, Box, Tri, Epa, Biweight, Triweight, Tricube,
Cosine.
A schematic diagram of the nine kernel functions in the KDEpy library is shown below:
Read the full text -> A total of 2.79k words
August 29, 2023
·
8 min read
A univariate plot (chart for one variable) refers to drawing a corresponding plot using one variable from a dataset. To visualize this variable, a plot must be drawn according to the different data variable types. Data variables are divided into continuous variables and discrete variables.
Read the full text -> A total of 1.80k words
August 27, 2023
·
7 min read
走进消息队列
#
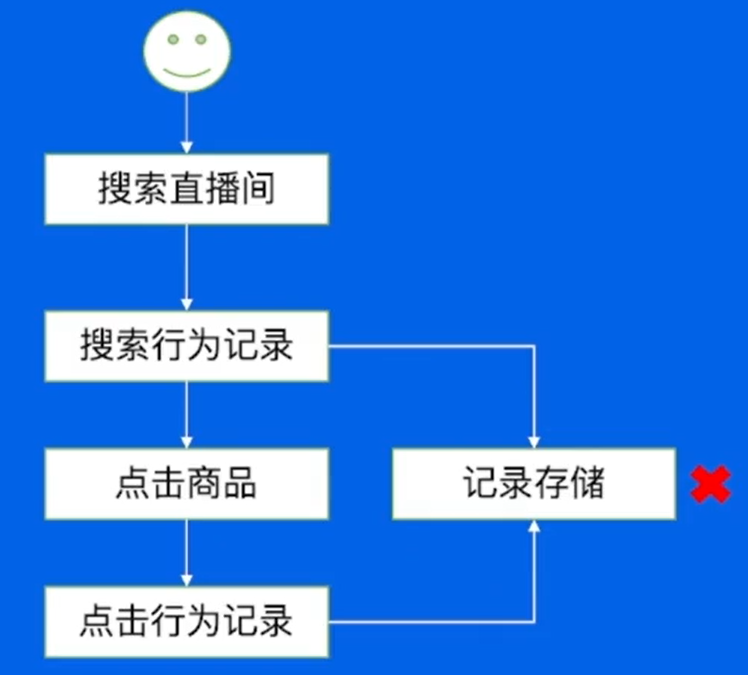
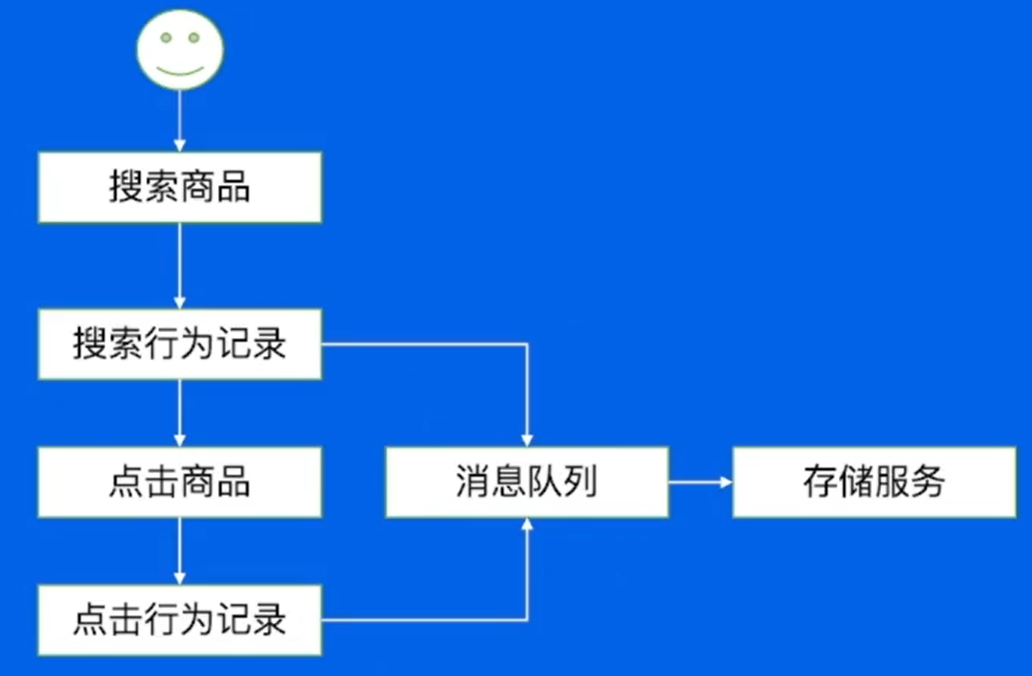 面对存储行为服务崩溃的时候,可以采用解耦的方式,将记录加入消息队列中,然后作为生产者,此时存储服务作为一个消费者来消耗。
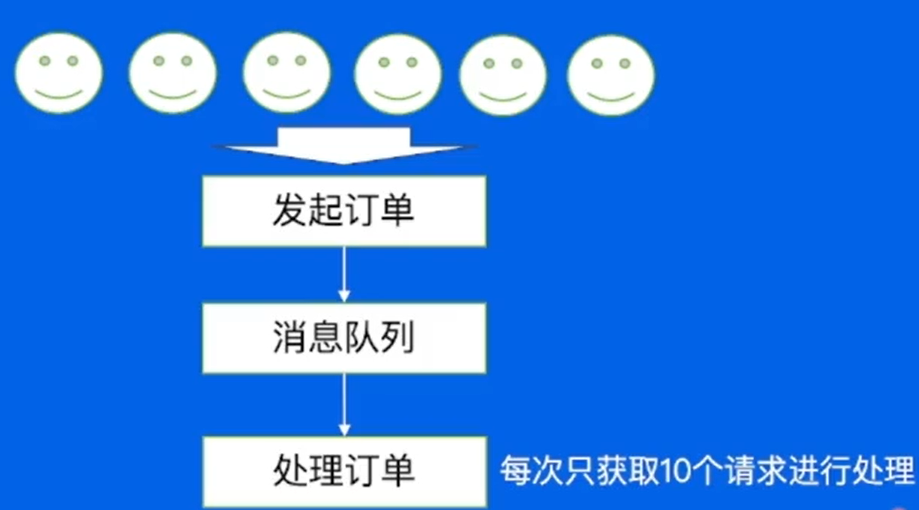
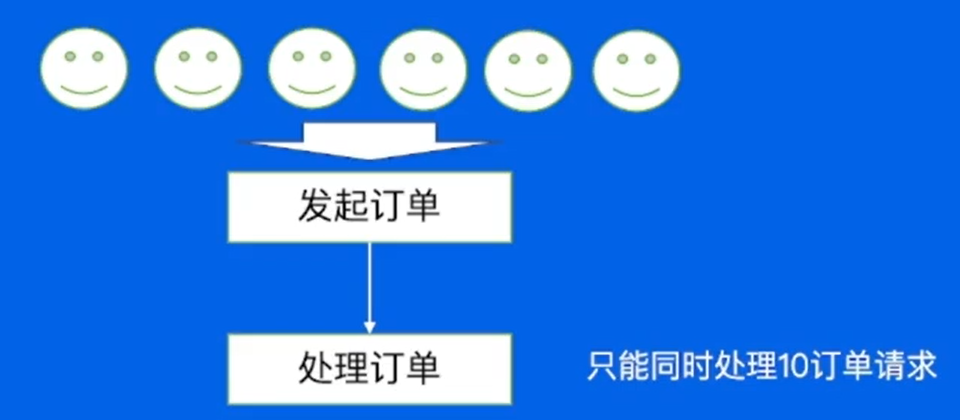
面对多个请求同时进行时,可以采用削峰的方式解决,将订单也加入消息队列中,然后每次只处理 10 个请求。
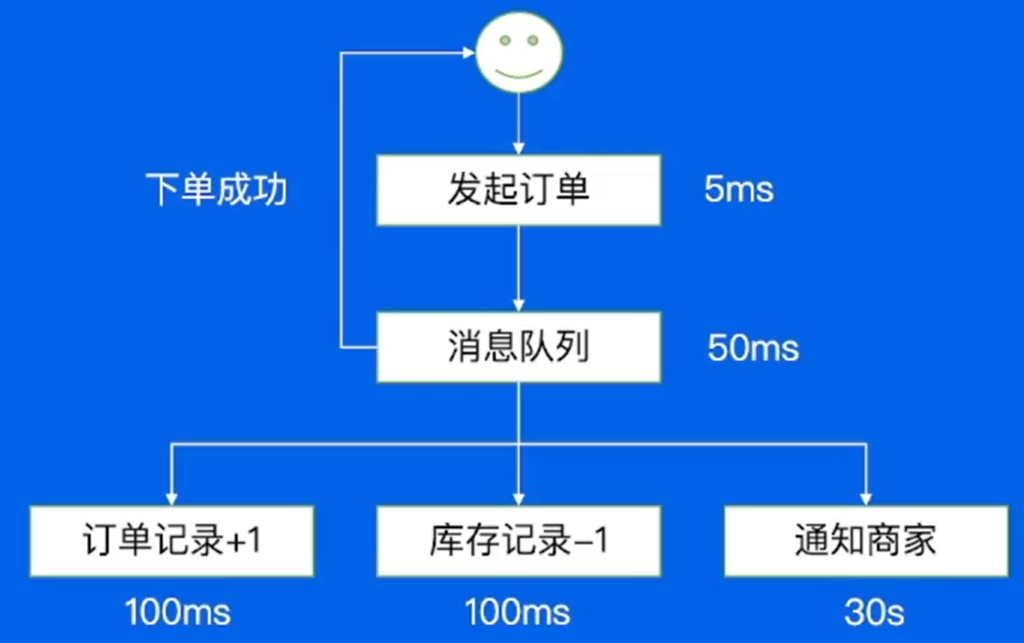
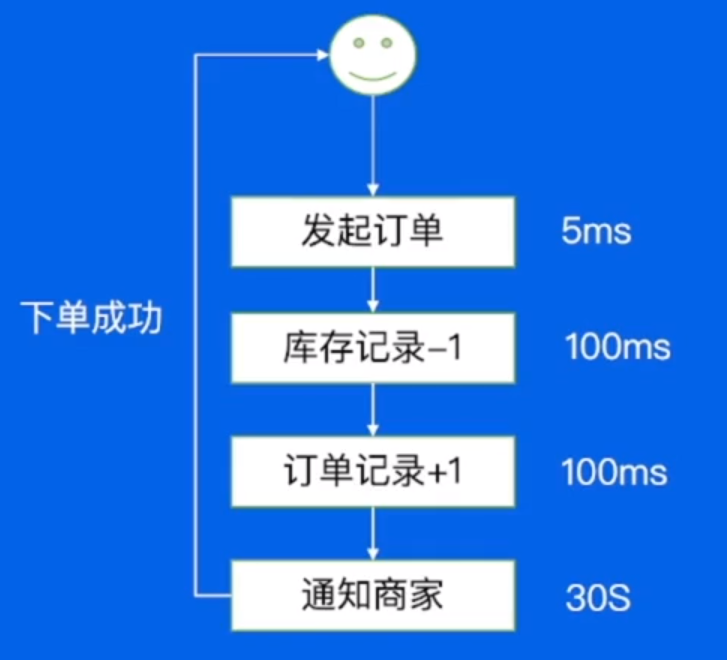
把发起订单的请求放入消息队列中,这时就可以通知客户下单成功了,然后将下面的三个请求异步地执行即可。

将日志放入消息队列中,然后通过日志的相关组件例如 ES 引擎等等,Kibana 展示平台进行分析。
Read the full text -> A total of 1.46k words
August 27, 2023
·
12 min read
抖音背后的存储
#
- 短视频生产/消费:片源系统->审核系统->推荐系统
- 公共系统:客户端、账号系统、评论系统
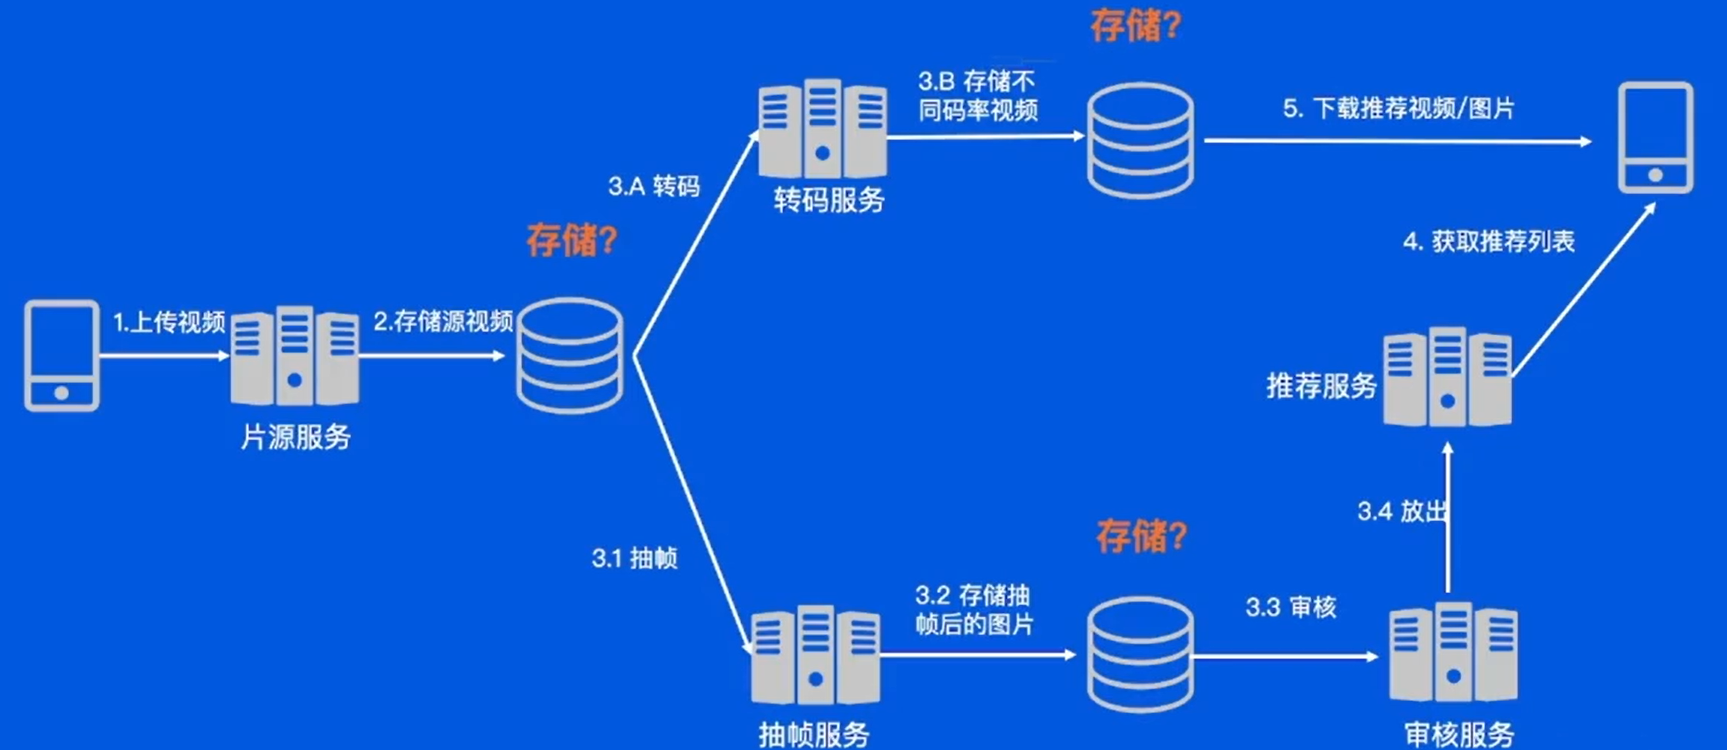
处理流程:
- 手机上传视频到片源服务,片源服务将视频存储。
- 片源服务将视频发送抽帧服务和转码服务。
- 抽帧服务将视频抽帧采样并存储。
- 转码服务将原视频转换为不同清晰度、不同码率的视频并存储。
- 抽帧后的图片被送往审核服务。
- 机器或人工审核过后视频被传给推荐服务。
- 用户可以获取推荐列表或下载推荐视频/图片。
存储量分析:
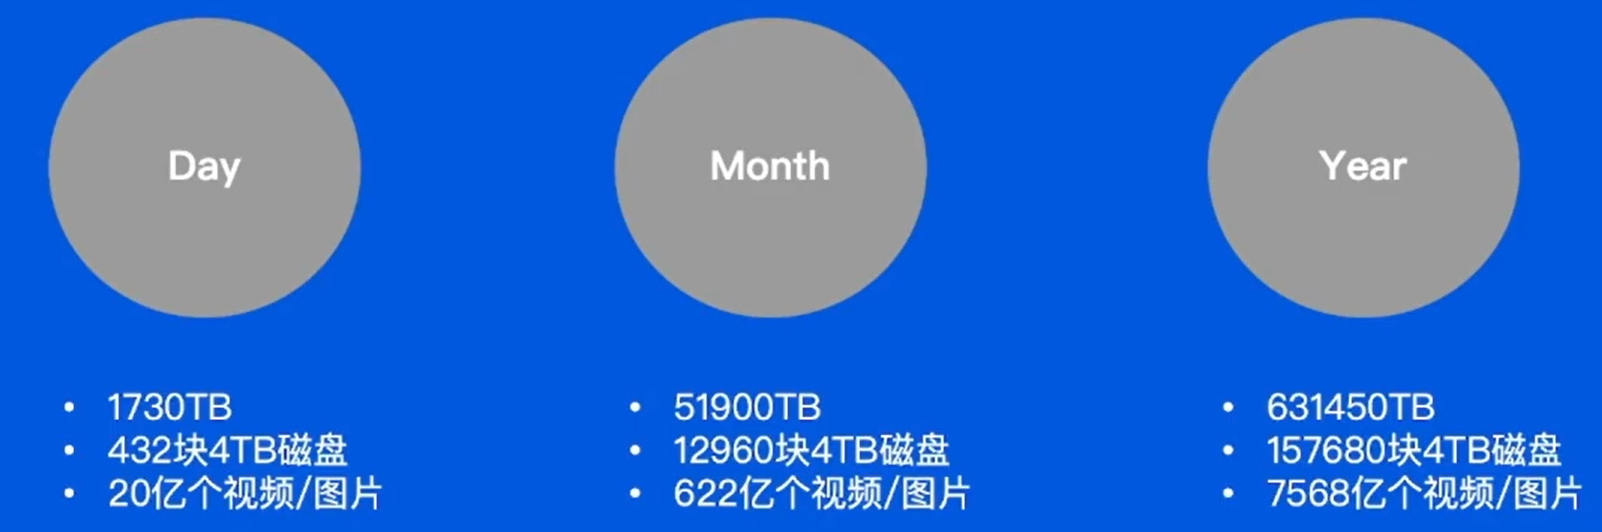
因此存储要求:易用、海量、便宜。
Read the full text -> A total of 2.42k words
August 26, 2023
·
6 min read
Users sometimes need to customize layer properties such as fonts, tick axes, spines, and legends according to a journal’s figure-drawing requirements, which is time-consuming and can also easily cause users to overlook some layer-detail requirements.
As a third-party extension toolkit specifically for drawing scientific-paper figures, SciencePlots provides Matplotlib plot styles (Matplotlib Styles) for mainstream English-language scientific journals (such as Nature, Science, and IEEE).
The installation code for SciencePlots is as follows:
Read the full text -> A total of 1.26k words
August 25, 2023
·
12 min read
Figures for scientific papers impose higher requirements on the rendering conditions of multilayer elements (fonts, axes, legends, etc.), and we need to change multiple rendering parameters in Matplotlib and Seaborn, especially when drawing complex figures containing multiple subplots, which can easily make the plotting code verbose.
As a concise Matplotlib wrapper, the ProPlot library is a high-level wrapper for Matplotlib’s object-oriented plotting method (object-oriented interface), integrating the cartopy/Basemap mapping libraries, xarray, and pandas, and can compensate for some of Matplotlib’s shortcomings. ProPlot can give Matplotlib enthusiasts a smoother plotting experience.
Read the full text -> A total of 2.57k words
August 24, 2023
·
3 min read
Seaborn provides a more advanced encapsulation on top of Matplotlib, enabling users to use very little code to draw a visualization library for scientific paper figures with rich statistical information. Seaborn is based on Matplotlib, most parameters of plotting functions in Matplotlib can be used in Seaborn plotting functions, and it provides good support for other Python libraries (such as Numpy/Pandas/Scipy).
Install Matplotlib
python -m pip install matplotlib
Install Seaborn
Read the full text -> A total of 0.77k words
August 23, 2023
·
12 min read
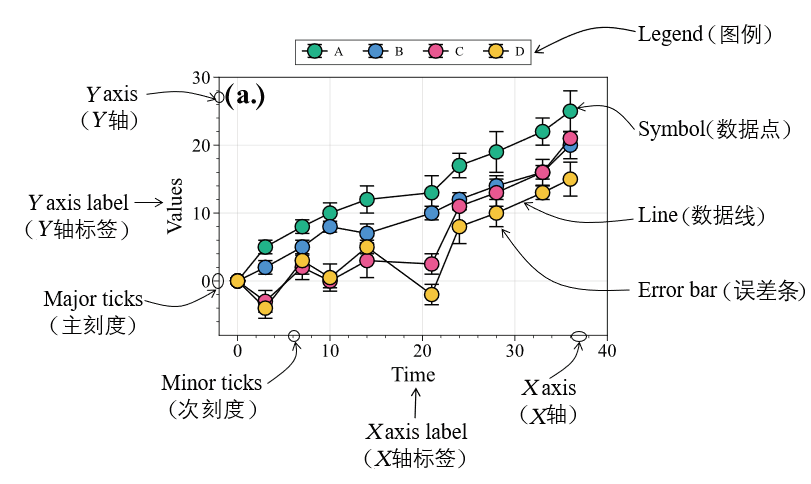
Drawing Specifications
#
Example of the basic composition of a scientific paper figure
Read the full text -> A total of 2.50k words
August 22, 2023
·
2 min read
Python has multiple third-party libraries, including the basic plotting library Matplotlib, the statistical analysis visualization library Seaborn, the scientific plotting library ProPlot, and the scientific plotting theme library SciencePlots.
Read the full text -> A total of 0.44k words