August 27, 2023
·
12 min read
抖音背后的存储
#
- 短视频生产/消费:片源系统->审核系统->推荐系统
- 公共系统:客户端、账号系统、评论系统
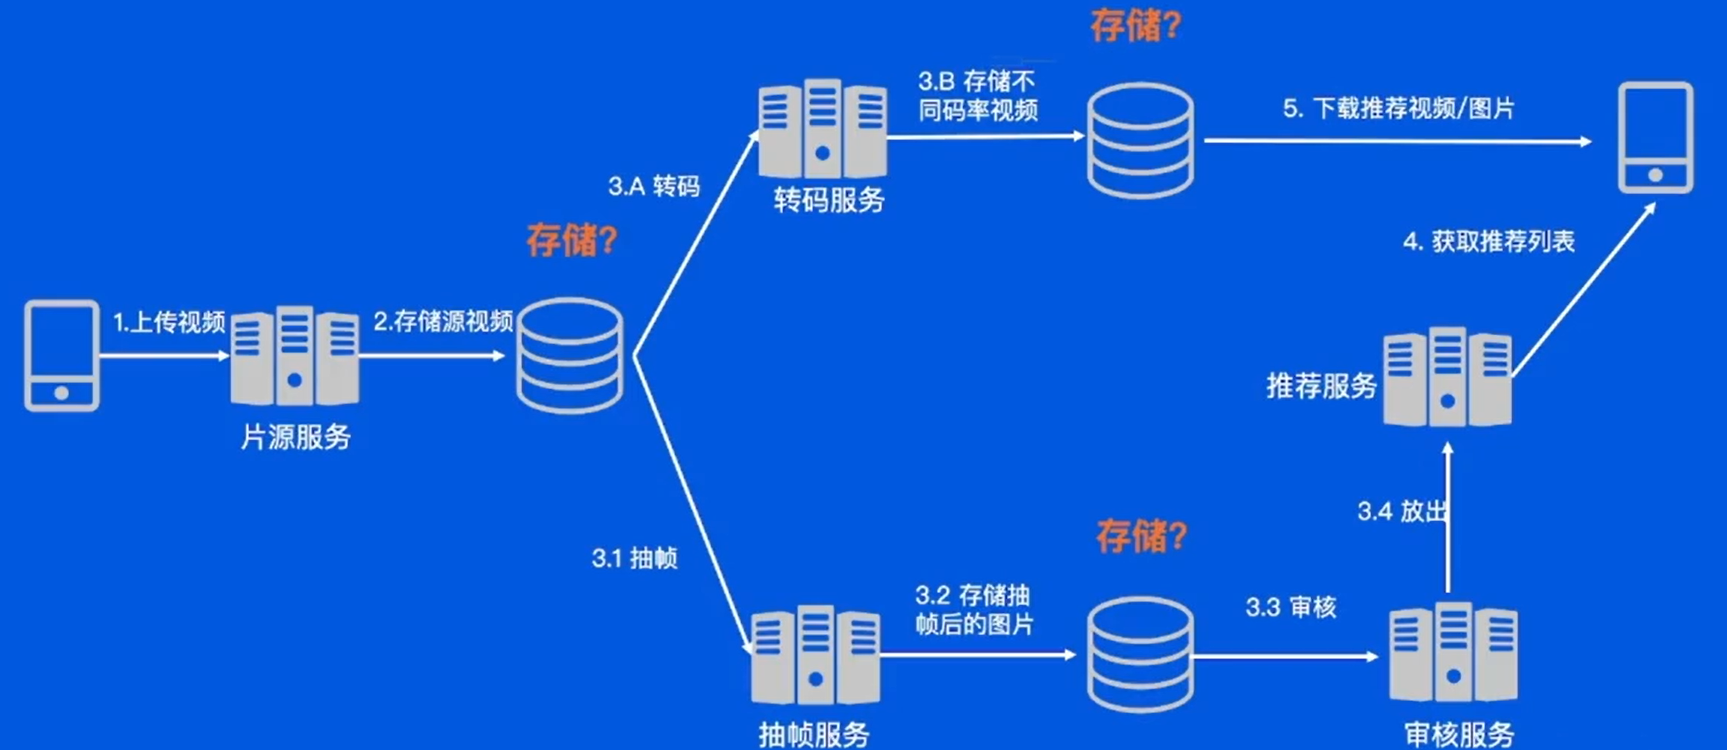
处理流程:
- 手机上传视频到片源服务,片源服务将视频存储。
- 片源服务将视频发送抽帧服务和转码服务。
- 抽帧服务将视频抽帧采样并存储。
- 转码服务将原视频转换为不同清晰度、不同码率的视频并存储。
- 抽帧后的图片被送往审核服务。
- 机器或人工审核过后视频被传给推荐服务。
- 用户可以获取推荐列表或下载推荐视频/图片。
存储量分析:
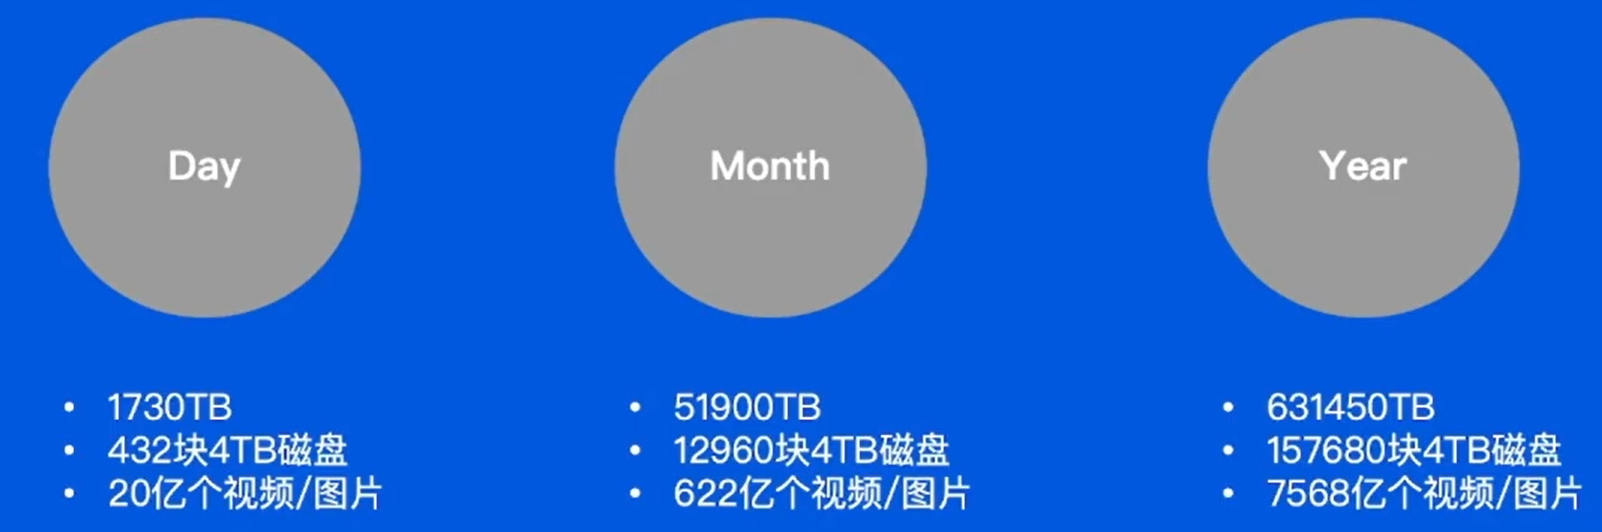
因此存储要求:易用、海量、便宜。
...
August 26, 2023
·
6 min read
Users sometimes need to customize layer properties such as fonts, tick axes, spines, and legends according to a journal’s figure-drawing requirements, which is time-consuming and can also easily cause users to overlook some layer-detail requirements.
As a third-party extension toolkit specifically for drawing scientific-paper figures, SciencePlots provides Matplotlib plot styles (Matplotlib Styles) for mainstream English-language scientific journals (such as Nature, Science, and IEEE).
The installation code for SciencePlots is as follows:
...
August 25, 2023
·
12 min read
Figures for scientific papers impose higher requirements on the rendering conditions of multilayer elements (fonts, axes, legends, etc.), and we need to change multiple rendering parameters in Matplotlib and Seaborn, especially when drawing complex figures containing multiple subplots, which can easily make the plotting code verbose.
As a concise Matplotlib wrapper, the ProPlot library is a high-level wrapper for Matplotlib’s object-oriented plotting method (object-oriented interface), integrating the cartopy/Basemap mapping libraries, xarray, and pandas, and can compensate for some of Matplotlib’s shortcomings. ProPlot can give Matplotlib enthusiasts a smoother plotting experience.
...
August 24, 2023
·
3 min read
Seaborn provides a more advanced encapsulation on top of Matplotlib, enabling users to use very little code to draw a visualization library for scientific paper figures with rich statistical information. Seaborn is based on Matplotlib, most parameters of plotting functions in Matplotlib can be used in Seaborn plotting functions, and it provides good support for other Python libraries (such as Numpy/Pandas/Scipy).
Install Matplotlib
python -m pip install matplotlib
Install Seaborn
...
August 23, 2023
·
12 min read
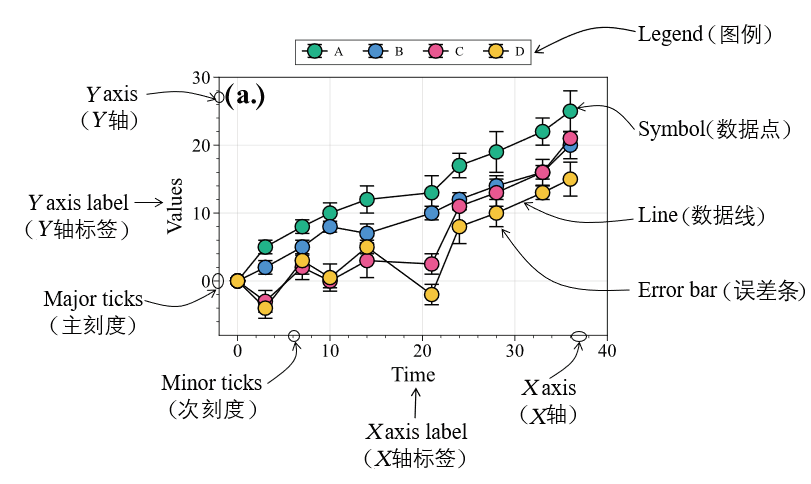
Drawing Specifications
#
Example of the basic composition of a scientific paper figure
...
August 22, 2023
·
2 min read
Python has multiple third-party libraries, including the basic plotting library Matplotlib, the statistical analysis visualization library Seaborn, the scientific plotting library ProPlot, and the scientific plotting theme library SciencePlots.
...
August 20, 2023
·
4 min read
Before the analysis, first convert the categorical variables low, race, smoke, ht, and ui in the birthwt dataset into factors.
library(MASS)
data(birthwt)
str(birthwt)

options(warn=-1)
library(dplyr)
birthwt <- birthwt %>%
  mutate(low = factor(low, labels = c("no", "yes")),
         race = factor(race, labels = c("white", "black", "other")),
         smoke = factor(smoke, labels = c("no", "yes")),
         ht = factor(ht, labels = c("no", "yes")),
         ui = factor(ui, labels = c("no", "yes")))
str(birthwt)
August 19, 2023
·
13 min read
1. Getting to Know the ggplot2 Package
#
The ggplot2 package provides a plotting system based on a grammar of layers. It remedies the lack of consistency among functions in R’s base graphics system and raises R’s plotting capabilities to an entirely new level. The basic principles of the various data visualizations in ggplot2 are completely consistent: it maps mathematical space to the space of graphical elements. Imagine a blank canvas. On the canvas, we need to define the data to be visualized (data) and the mapping from data variables to graphical properties (mapping).
...
August 19, 2023
·
12 min read
R’s base graphics system was written by Ross Ihaka and is very powerful. It consists mainly of the graphics and grDevices packages, which are loaded automatically when R starts. There are two types of functions in the base graphics system: high-level plotting functions and low-level plotting functions.
High-level plotting functions are functions used to produce plots directly, including plot( ), hist( ), boxplot( ), and pairs( ). Low-level plotting functions are functions used to add new graphics or elements to a plot drawn by a high-level plotting function, including points( ), lines( ), text( ), title( ), legend( ), and axis( ).
...
August 19, 2023
·
8 min read
Handling Missing Values
#
In actual data analysis, missing data are frequently encountered. Missing values usually occur because data were not collected or were not entered.
For example, a missing age may be due to someone not providing his (her) age. Most statistical analysis methods assume that complete datasets are being processed. Therefore, apart from some specialized books, most statistics textbooks rarely address this issue. In fact, before conducting a formal analysis, we need to check whether the dataset contains missing values during the data preparation stage and use some methods to compensate for the loss caused by missing values.
...